

I hope to make this into a series of posts that dive into the AppWorkload.log and the Win32app policies inside it. We’ll start with an introduction to the log and the policies, and then move into the specifics of what you can see and decipher.
If you have ever worked with Intune, you have come across the many logs that the Intune Management Extension creates. But when troubleshooting Win32app deployments, the AppWorkload.log is one that you will have seen before.
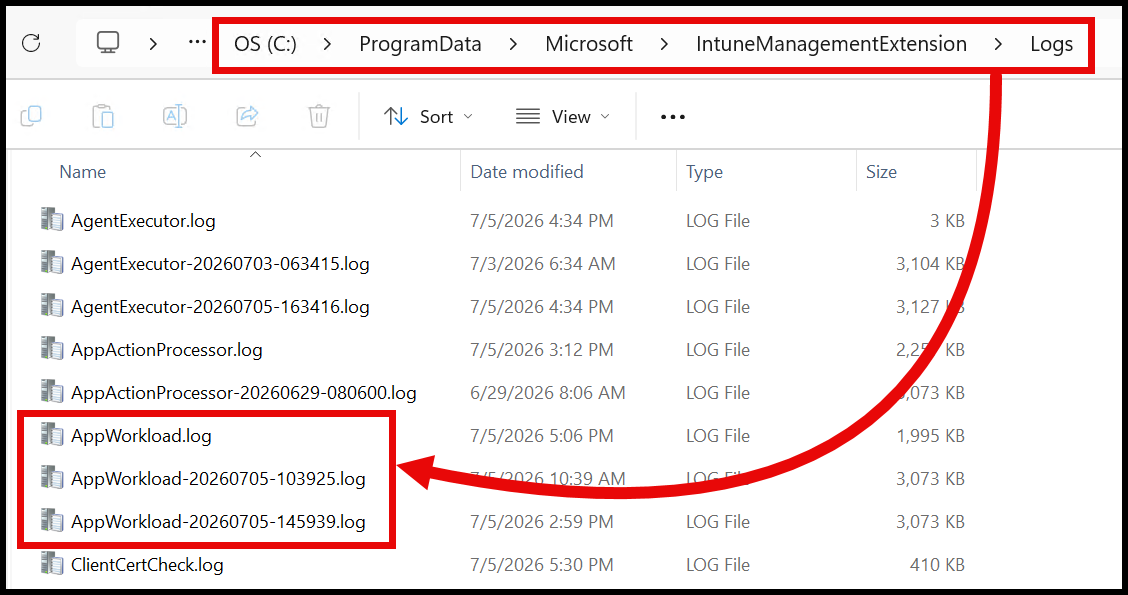
The AppWorkload.log is nothing new; it has been around for a couple of years now after it was broken out of the IntuneManagementExtension.log.
And there is a JSON array hidden inside with a wealth of information about the Win32app deployments.
What is the AppWorkload.log? #
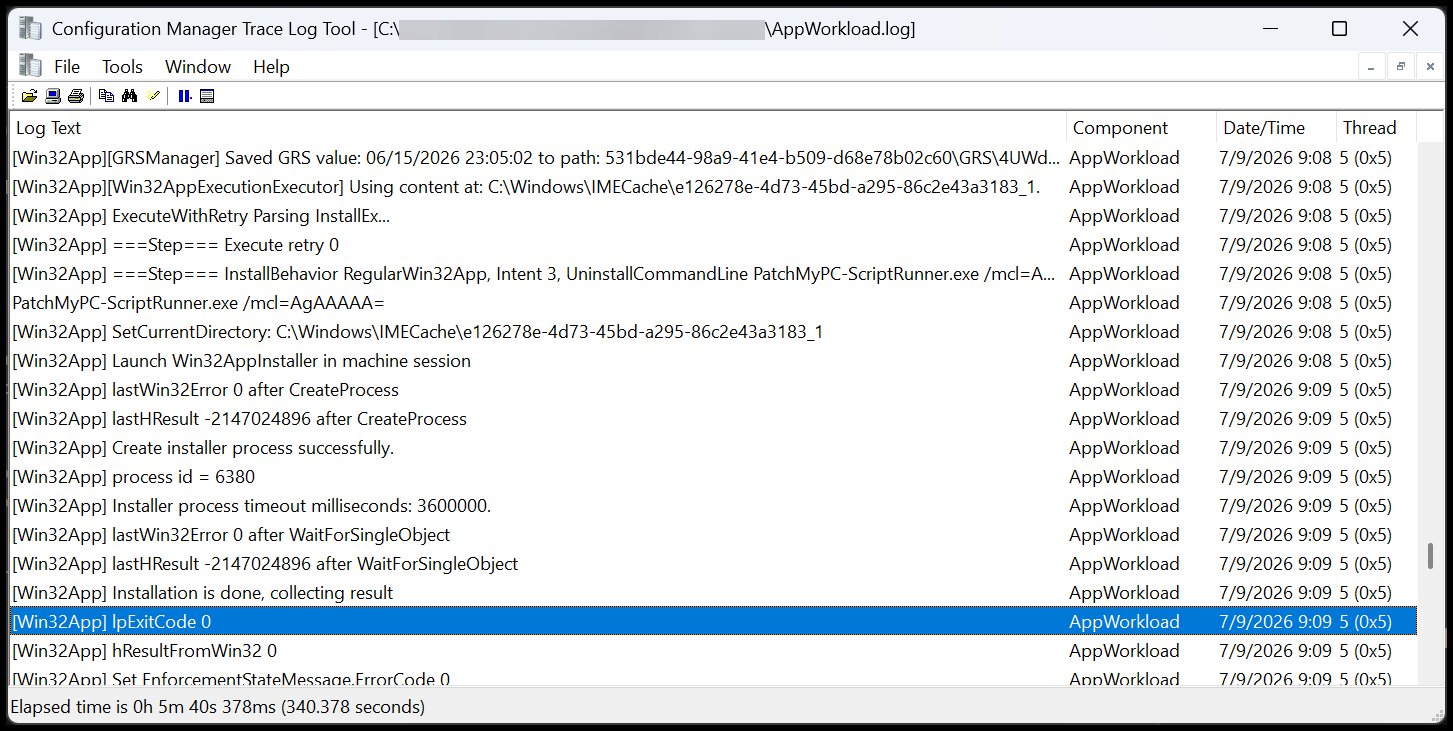
As the docs page says, the AppWorkload.log helps troubleshoot and analyze Win32 app deployment activities. Inside you’ll see lines about detection scripts being run, requirements being evaluated, and install commands being executed.
But if you’re like me, and are troubleshooting Win32app deployments every day, there is a log line that is extra special.
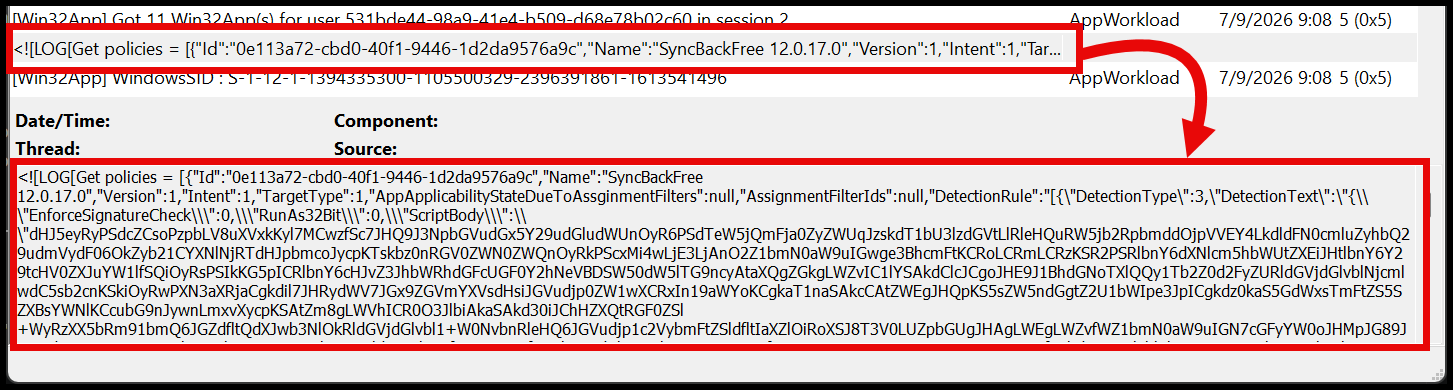
And it starts with get policies =.
When do these lines show up? #
The Intune Management Extension (IME) will evaluate the policies that are assigned to the user and device. When it syncs the policies, the results are written to the AppWorkload.log. It will run an app check-in for both “Available” and “Required” apps, resulting in two separate log lines.
Required Apps #
For the most part, required app check-ins occur every 60 minutes. This is a default timer, but other things can trigger a check-in, like hitting the “Sync” button in the Company Portal, a user logging on, or an assignment deadline being reached.
When this happens, the IME will check for all logged on users and pull down the policies for each user. Device-assigned apps ride along in each user’s response. If there are no users logged on, the SYSTEM/Device is used to check for device-assigned apps.
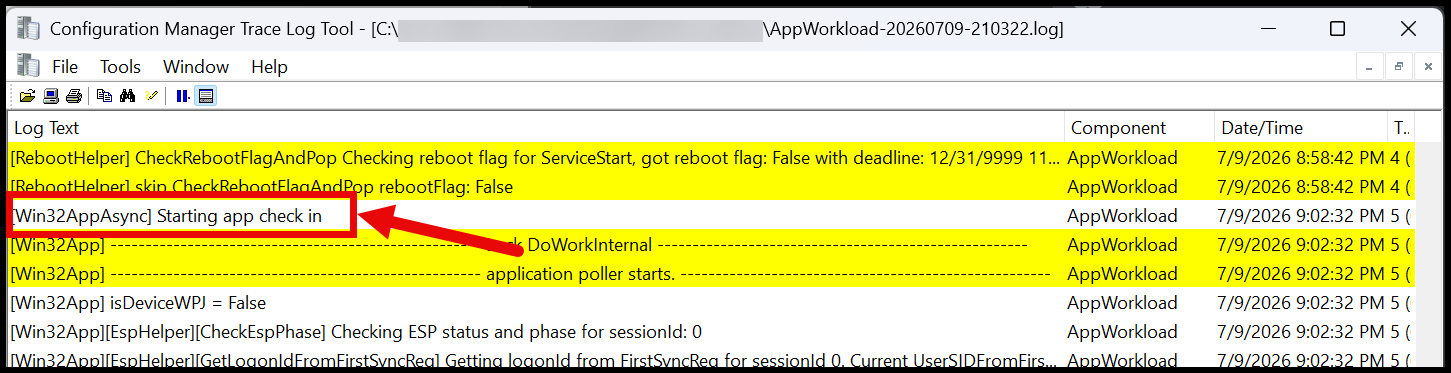
In the log, you will see the sync start with the line:
[Win32AppAsync] Starting app check in
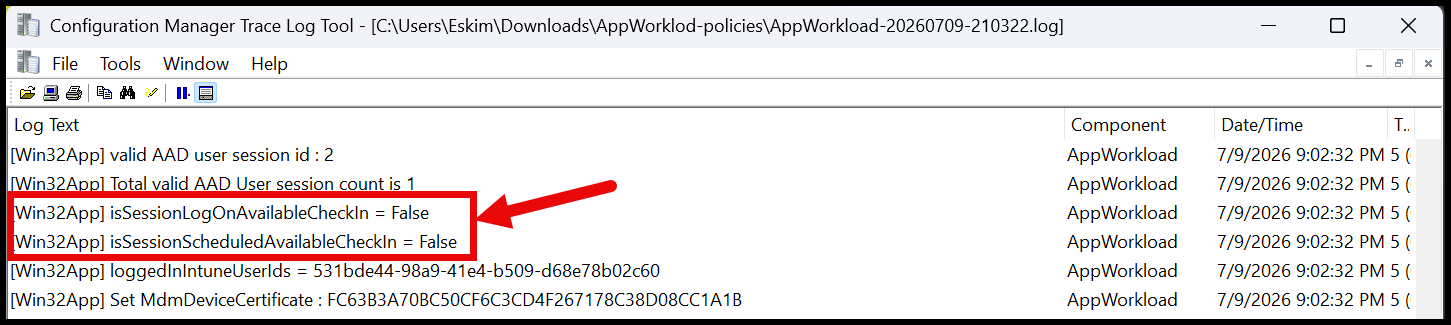
You can also confirm this is a required app check-in by looking for the lines:
-
[Win32App] isSessionLogOnAvailableCheckIn = False -
[Win32App] isSessionScheduledAvailableCheckIn = False
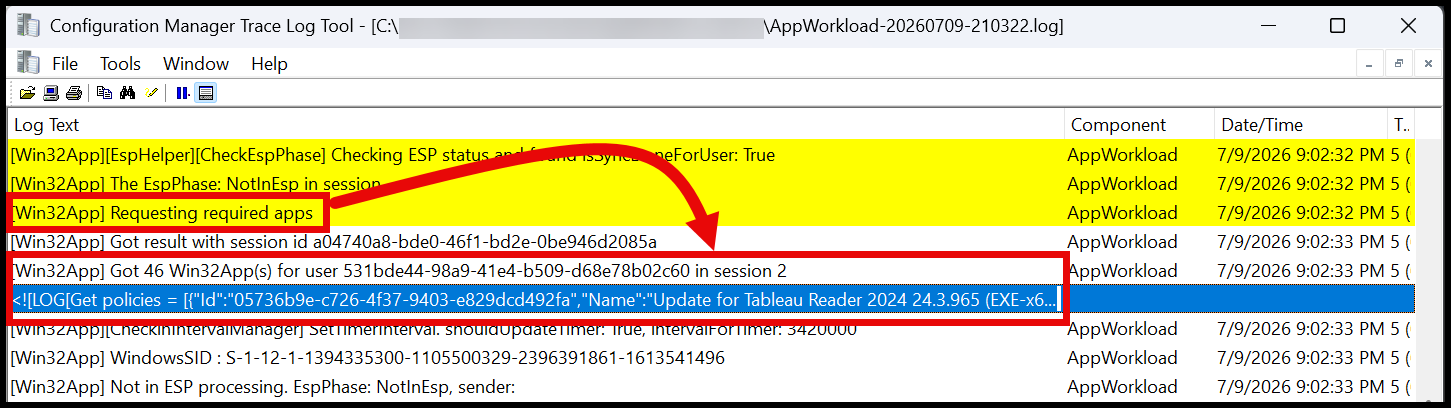
And as the policies are pulled down, you will see the results in the log:
[Win32App] Requesting required apps
After that you should see some results. In this example, we got 46 apps, followed by the get policies = line.
Available Apps #
Available app check-ins are user-driven and really only occur whenever someone hits “Sync” or opens the Company Portal, at user logon, or a quiet 8-hour scheduled fallback that runs if a user is logged on.
Because “available” assignments are only for the Company Portal, these check-ins always run per signed-in Entra ID user. You won’t see them for the SYSTEM, and they’re skipped entirely on multi-session SKUs.
In the log, you will see similar lines, but focused on ‘Available’ apps:
[Win32AvailableAppAsync] Starting app check in
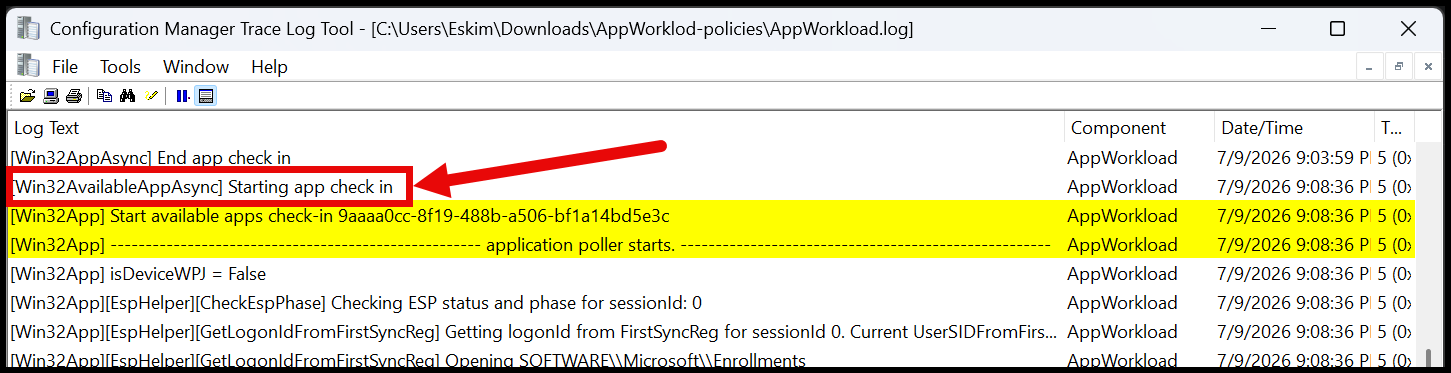
The isSession Available CheckIn lines can look like this:
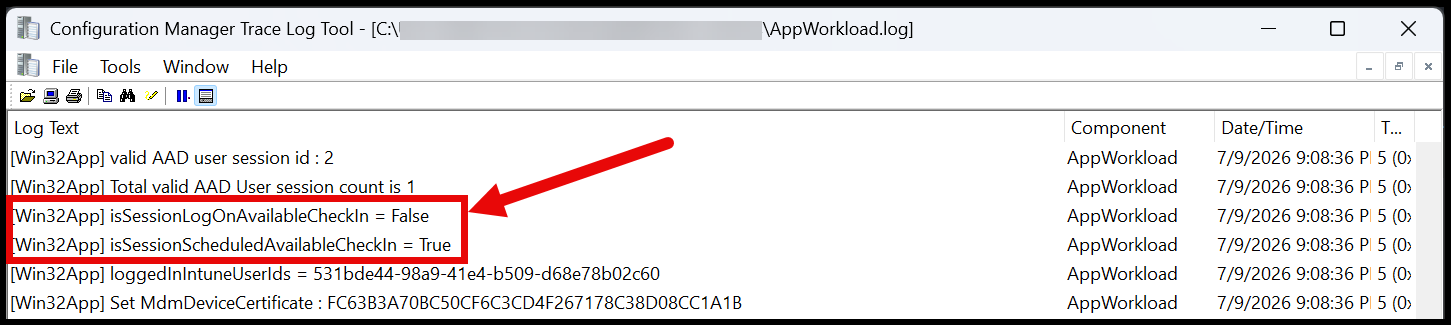
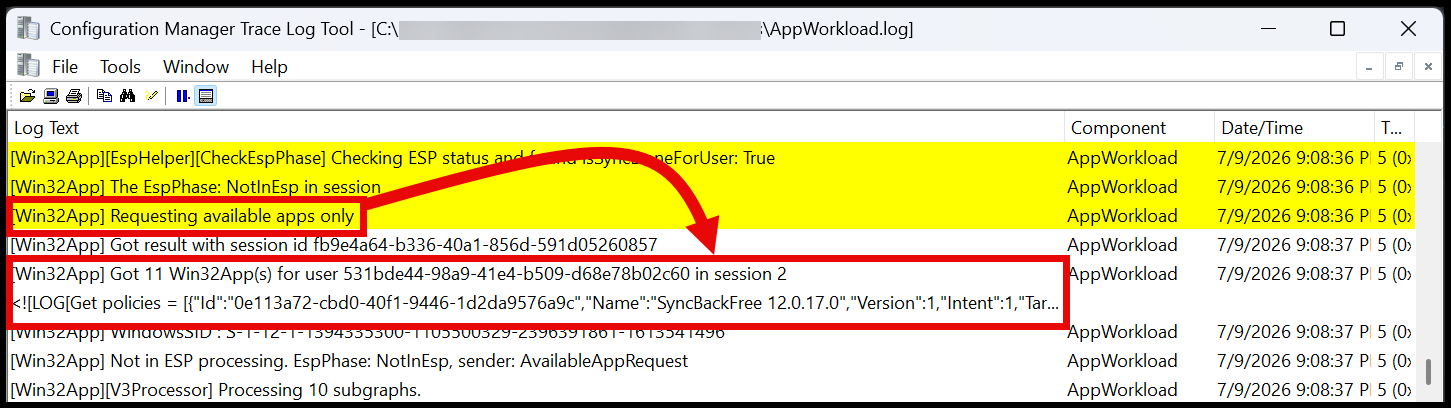
And as the policies are pulled down, the line reads a bit differently:
[Win32App] Requesting available apps only
And the results lines should look just the same:
Show me the Policies #
But what is in those get policies = lines??!?
In these lines, you will see a JSON array that contains all of the Win32app information that was returned from the app check-in. And it includes so much information!
Let’s get that JSON out of there by doing it the most manual way possible. In the future we’ll look at some easier ways, but right now, the point is to know where everything comes from.
Don’t use CMTrace to Extract #
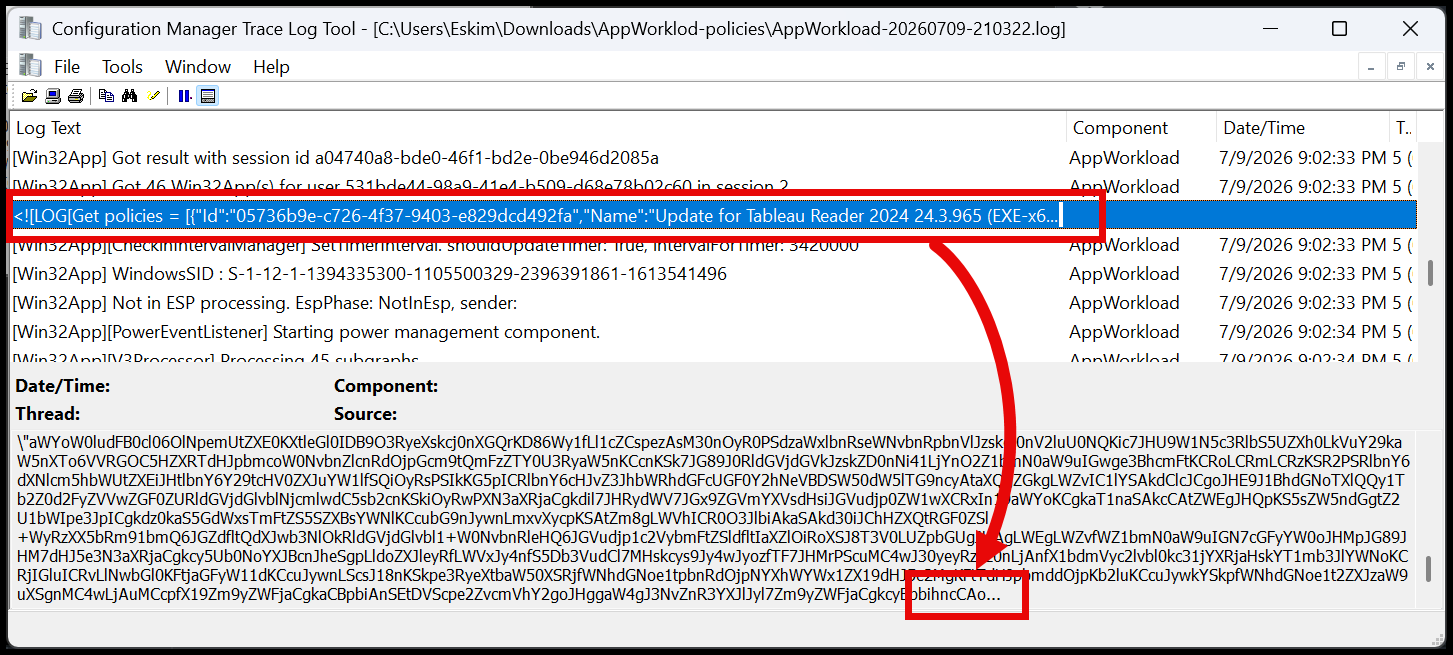
I love CMTrace as much as the next ConfigMgr admin. But the get policies = lines are most likely going to be truncated in the details pane of CMTrace.
For example, here we can see the policy starts out great. We see the start of some information for an app…
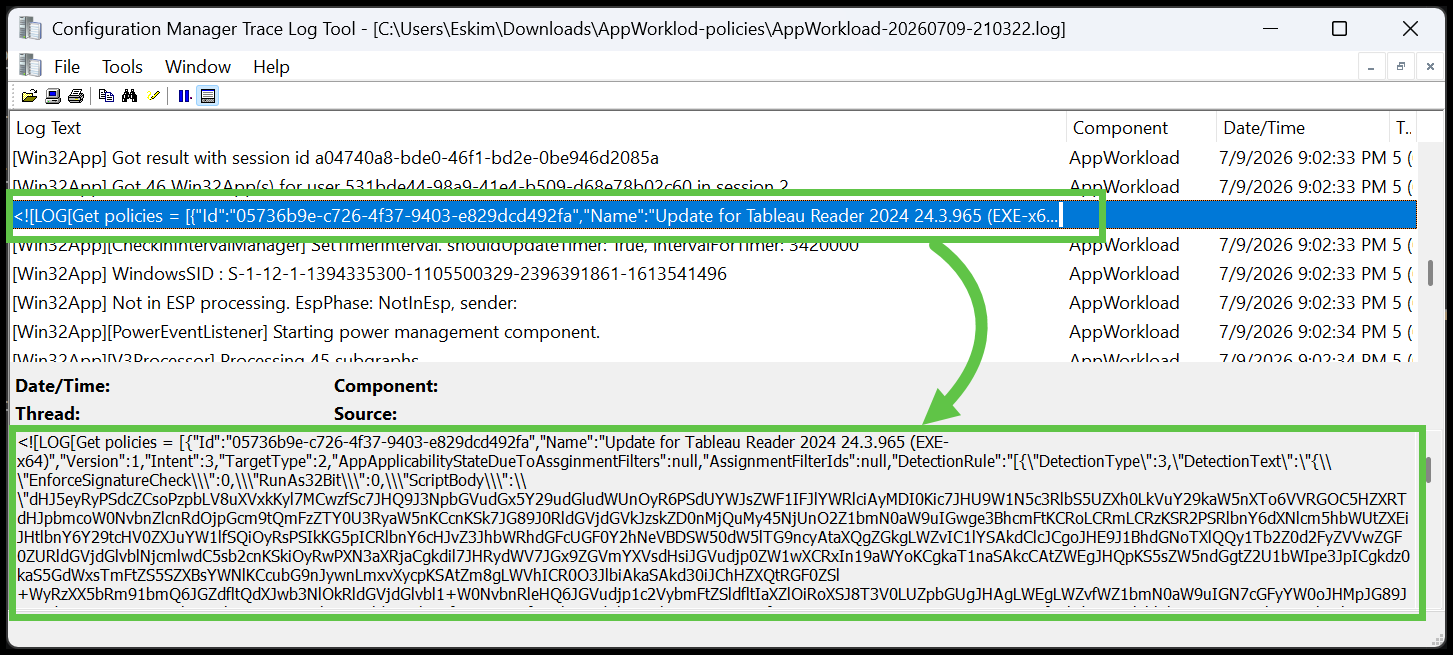
But if we scroll down to the bottom, the rest of the JSON is missing.
How about Notepad++? #
Let’s use a text editor that also has some plugins that can help us out.
Search and find the get policies = line in the AppWorkload.log. From there, you are going to want to start your selection at the first [ character after the = sign.
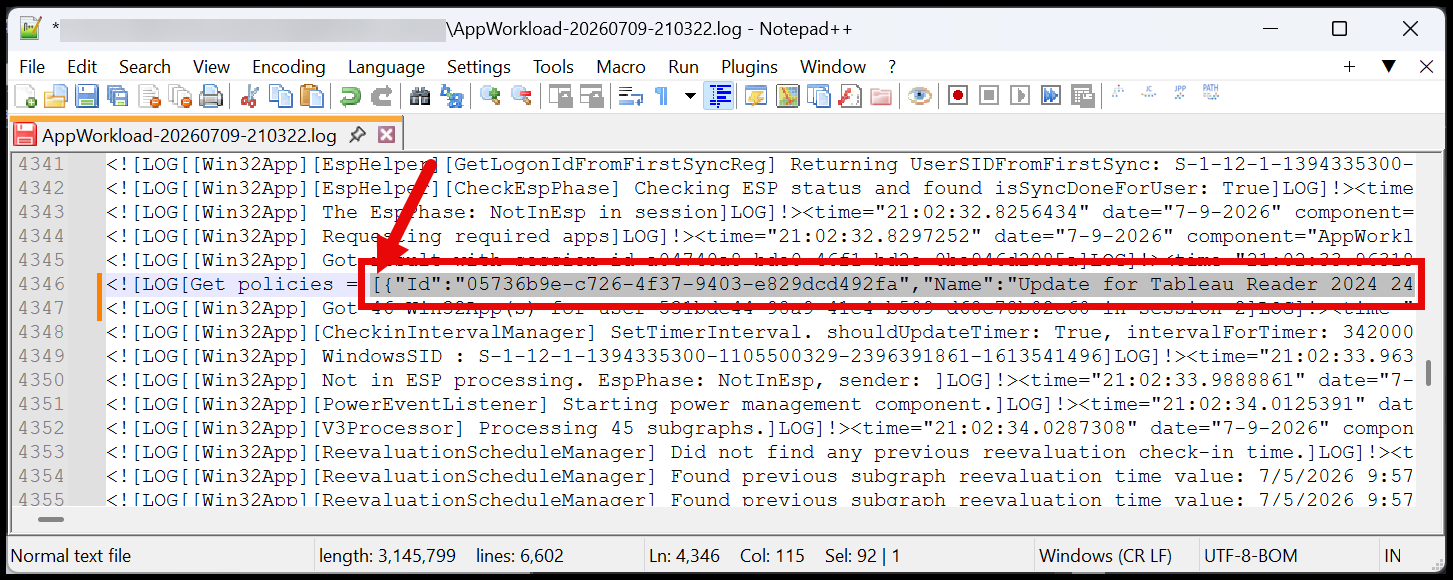
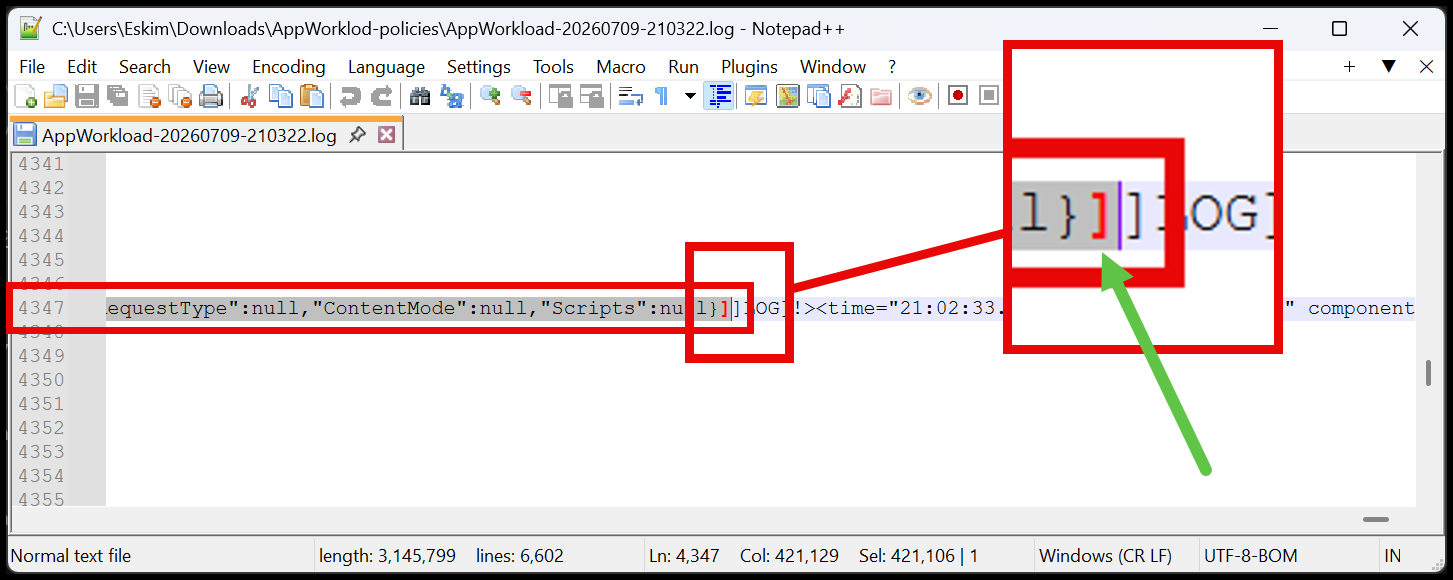
Then scroll down to the end of the line and select all the way to the last ] character of the JSON array.
There will be two closing ] characters, one for the JSON array and one for the log line.
Ensure you are selecting the closing ] character of the JSON array.
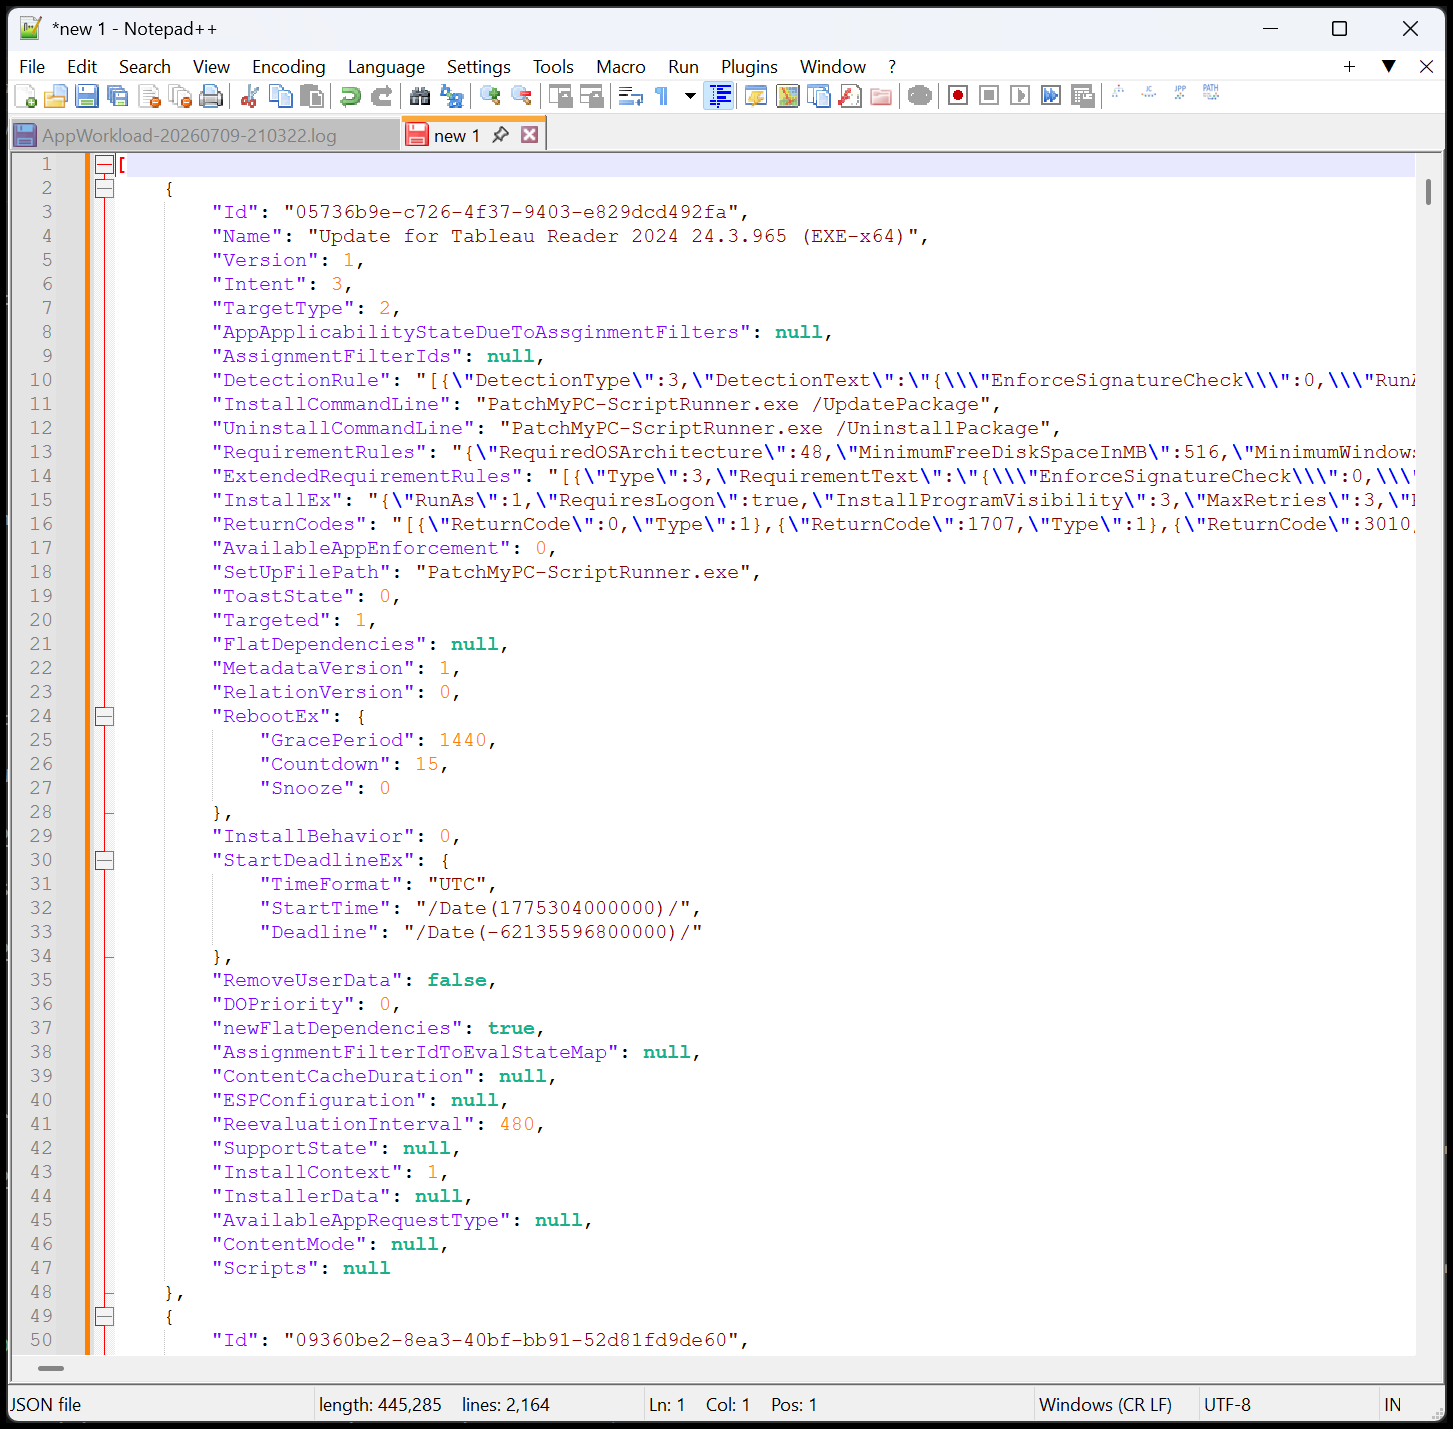
Open a new file, and paste the JSON array into it.

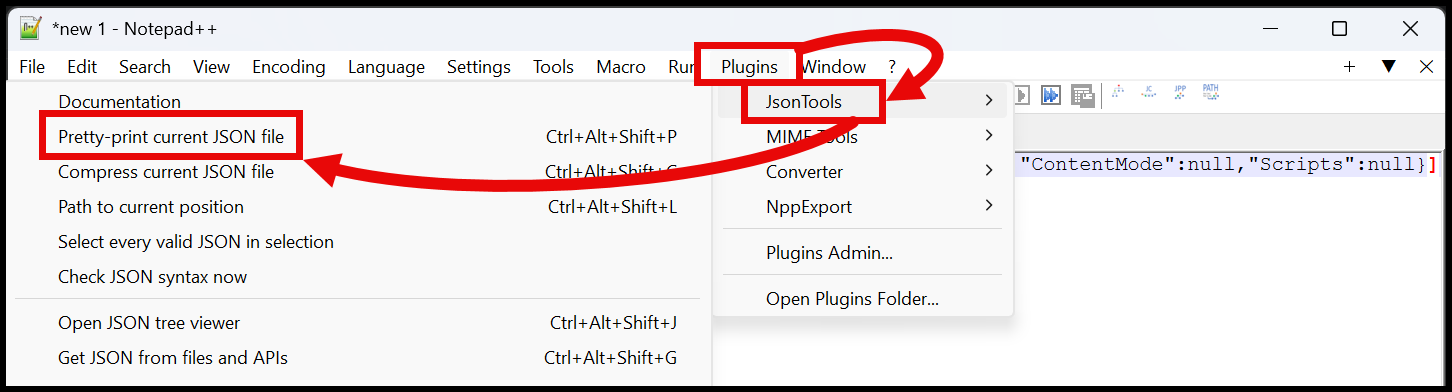
Install the JSON Tools plugin for Notepad++ to help format and view JSON data.
From the Plugins menu, select JSON Tools and then select “Pretty-print current JSON file”
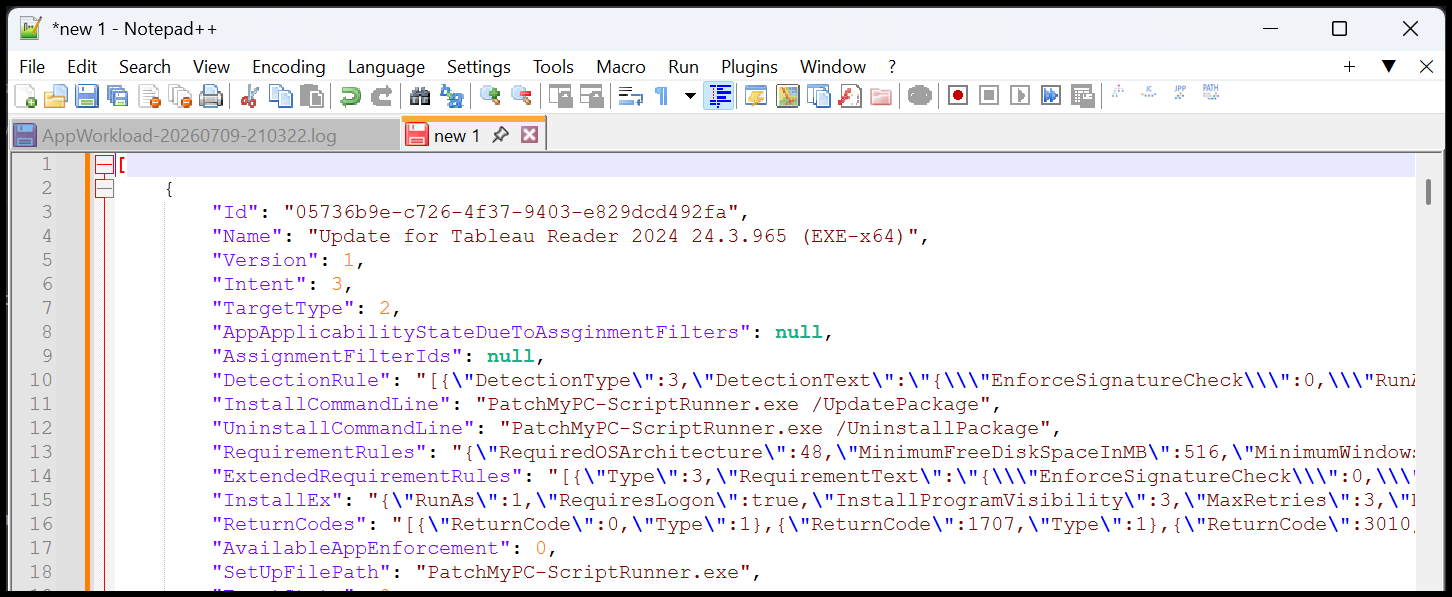
And now you can marvel in all its glory! Win32app policy information!
What’s all there? #
Almost everything you would want to know about the Win32app is in this JSON array: install commands (including script installers), detection rules (even the scripts), as well as dependency and supersedence information. So much of it is a lifesaver for troubleshooting.
Some of the information is obvious, like the app name, description, Return Codes:
[
    {
        "Id": "05736b9e-c726-4f37-9403-e829dcd492fa",
        "Name": "Update for Tableau Reader 2024 24.3.965 (EXE-x64)",

        ...

        "ReturnCodes": "[{\"ReturnCode\":0,\"Type\":1},{\"ReturnCode\":1707,\"Type\":1},{\"ReturnCode\":3010,\"Type\":2},{\"ReturnCode\":1641,\"Type\":3},{\"ReturnCode\":1618,\"Type\":4}]",
    }
]
But some of it is less obvious:
Like what does a RequiredOSArchitecture of 48 mean?
[
    {
        "RequirementRules": "{\"RequiredOSArchitecture\":48,\"MinimumFreeDiskSpaceInMB\":516,\"MinimumWindows10BuildNumer\":\"10.0.14393\",\"MinimumMemoryInMB\":null,\"MinimumNumberOfProcessors\":null,\"MinimumCpuSpeed\":null,\"RunAs32Bit\":false}",
    }
]
Well, it means x64 and arm64. But once you know that, it could help you figure out why an app isn’t installing on a 32-bit machine, assuming you still have some of those around.
Future Posts #
This is what I want to cover in future posts: diving into certain areas of the JSON array and explaining what they mean, possible values, and how you can use that information to troubleshoot deployments.